With today’s bank panic still unfolding, many can’t help but think about the economic fallout from 2008’s financial crisis… and if 2023 will see a repeat.
Back then, a wave of bank failures toppled the economy and sent the unemployment rate soaring to 10%. And during the recession that followed, $2 trillion was wiped from the global economy.
With 2023’s bank failures rivaling what occurred during 2008, investors are on edge.
Main Street is watching nervously for signs that banks will once again take down the rest of the economy.
But for now, the issues plaguing the financial sector appear contained to regional banks.
At 3.4%, the unemployment rate is hovering near the lowest levels of the past 60 years. The economy is also chugging along just fine.
But there’s a way to know if that’s about to change. One indicator in particular will signal if the bank crisis is about to spill over to Main Street.
So today, I’ll discuss what this indicator is… how to read it… and why you should use it to track what’s happening in the broader economy.
Tracking Bank Stress
The stress felt by banks can quickly spread to the rest of the economy if they decide to cut back on making loans.
This means less credit would be available for businesses.
Last week, I explained how this can choke off funding for new energy projects.
The same is true with other businesses across all areas of the economy. If credit isn’t available to fund that new warehouse or build a new factory, that can quickly tip the economy into a recession as business activity slows.
Inside Wall Street editor Nomi Prins agrees. As she wrote recently:
The banks also expect to earn less from their loan businesses this year as customers put their money in Treasurys instead of bank deposits.
That means banks have less capital to lend. This, in turn, could cause a credit crunch in the banking system.
That’s how a bank crisis morphs into a disaster impacting the entire economy… like what you saw in 2008.
The availability and cost of getting access to those funds are tracked with something called financial conditions.
When conditions are loose, that means credit is cheap and easy to access. When conditions are tight, it means funds are expensive or hard to obtain.
That’s why we track financial conditions… to know if strains are showing up in other areas of the market. A turn for the worse in financial conditions is how the bank crisis moves over to Main Street.
An Early Warning Indicator
The Federal Reserve is well aware of the impact that financial conditions have on the economy. And so the Fed’s Chicago district put together their own metric to track it.
It’s called the National Financial Conditions Index (NFCI). And it’s made up of 105 different measures of financial activity.
The chart below shows this indicator in action. Take a look…
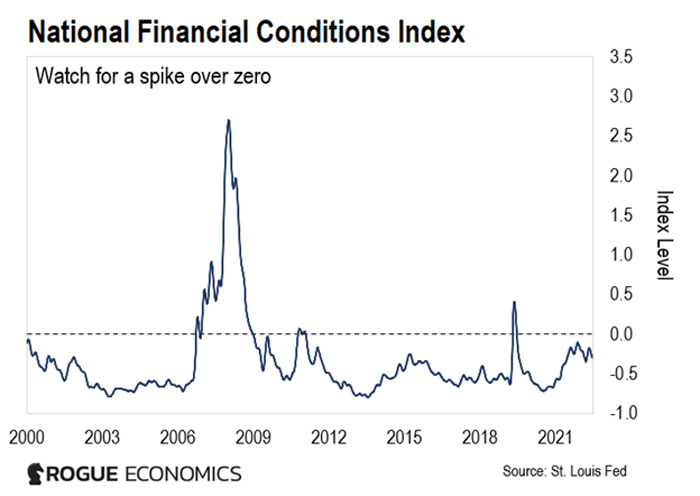
The black line at zero represents the long-term average for financial conditions.
The blue line represents the NFCI going back to the early 2000s.
When the blue line is below zero, then financial conditions are looser than average and that tends to be good for the economy.
But when the line goes above zero, that means conditions are tightening. And it signals credit is being cut off from businesses.
You can see the last time we had a meaningful spike in tighter conditions was ahead of the financial crisis in 2008. Conditions started tightening well before the worst of the recession hit.
Right now, conditions remain looser than average. That tells you the problems plaguing the bank sector shouldn’t have a negative impact on the economy just yet.
But that can change in a hurry. A big jump above zero, like what happened in early 2008, would be a warning that the troubles facing banks are about to become a problem for Main Street as well.
And for investors, there’s another reason to keep an eye on the NFCI. The spike that occurred at the start of 2008 happened before the S&P 500 went on to sell off by over 40%.
That’s why we’re keeping a close eye on the NFCI. If it spikes, we’ll know the woes plaguing banks are about to turn into something worse for the economy and the market.
We’ll alert you in these pages if we get a warning signal. But you can also track it yourself here.
And if the NFCI does spike, you’ll know it’s time to be more conservative in your own portfolio allocation. That means shifting allocations away from stocks and into cash.
Best regards,
Clint Brewer
Analyst, Rogue Economics
P.S. Nomi is sounding the alarm on what she calls the biggest change to our money since 1971…
She found evidence that a small group of powerful people are colluding to virtually “ban” cash – leading to the end of the dollar as we know it. It’s a plan that the Federal Reserve, the White House, and the financial elite are set to enact as banks fail.
Pulling your cash out of the bank won’t be possible. But she found one asset that can help you become your own banker – and escape the clutches of this power grab. To learn more, watch Nomi’s urgent new video presentation right here.